IntentKey Platform
Helping self-service customers build an audience model and make sense of a lot of data, through a rebrand that landed mid-project.
Project receipts
- Role
- I led. Sole designer (UX/Product Design Engineer)
- Team
- Just me on design, working with product, engineering, and marketing.
- Timeline
- August 2025 to April 2026
- Tools
- Figma, Lovable
- Platform
- Web
A lot of data, and nobody to explain it.
IntentKey is Inuvo's AI-powered audience platform, and the public version of it was built for self-service. Someone describes the audience they want to reach in plain language, and the platform builds a model of it: the concepts tied to those people, how their interest and sentiment are trending, where they are, and who they are.
That is a lot of information to hand to someone who has never used the product, and nobody is there to walk them through it. The job was to make it easy for a first-time customer to build a model on their own, and then to make the model they got back easy to read.
The short version: A self-service customer has to build a model and make sense of a lot of data, with nobody there to explain it.
What I owned.
I was Inuvo's only designer. My title was UX/Product Design Engineer, but the work was product and UX design, not production code. I led the design of the Platform and came up with a lot of its strategy and features, and I led the rebrand that landed partway through.
I worked with product, engineering, and marketing. Figma was where the designs lived and where developers picked them up, and I used Lovable to visualize animations and interactions that I couldn't prototype well enough in Figma, so the handoff showed developers what I meant.
The short version: I led the design and a lot of the ideas, working alongside product, engineering, and marketing.
Starting with an empty box.
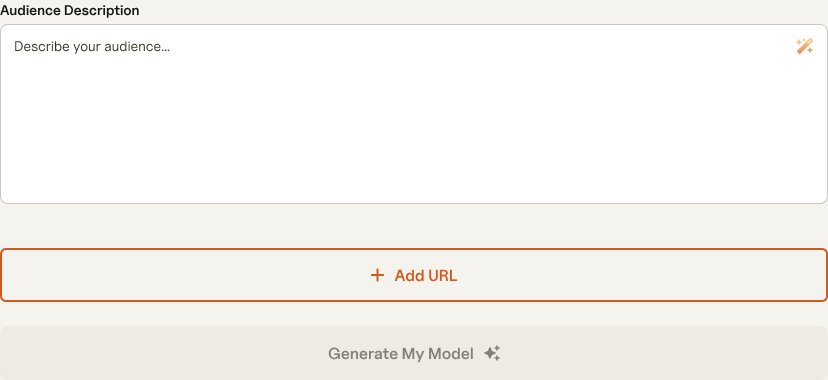
The first screen is a simple form: an audience description and, if you have them, product pages to learn from. The trouble with an empty text box is that people often know exactly who they want to reach and still can't describe them to a model.
So I proposed an AI assist right in the field. A small wand icon writes a starting description that you can edit, which gives people something to react to instead of a blank page. Underneath it, Add URL lets you point the model at up to 25 product pages, and the Generate My Model button stays grey until there is something to build from. The idea was approved, and I designed each state in Figma, from the empty field to an assisted description with a URL added.
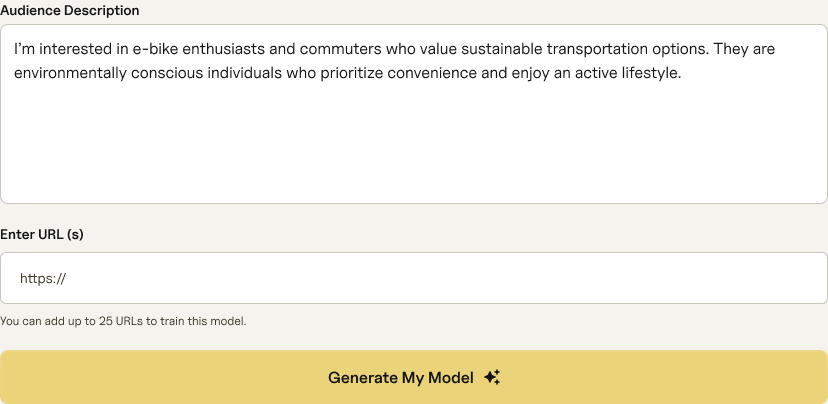
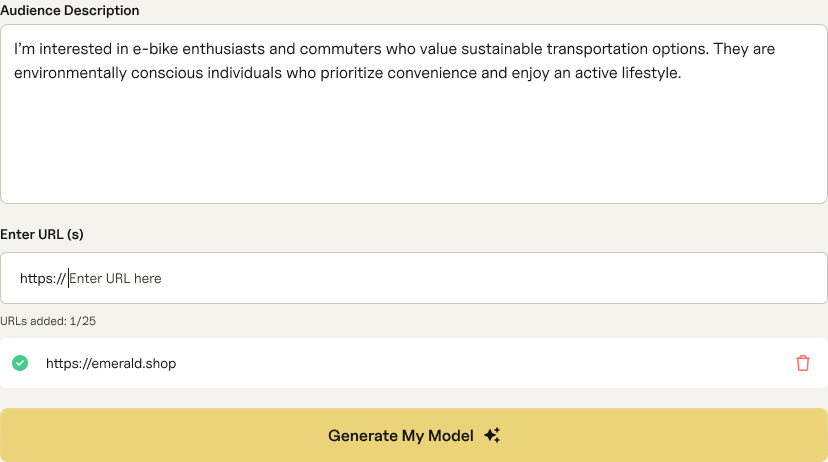
The short version: An AI assist inside the field gave people something to react to instead of a blank page, and the idea was approved.
Making a lot of data easy to read.
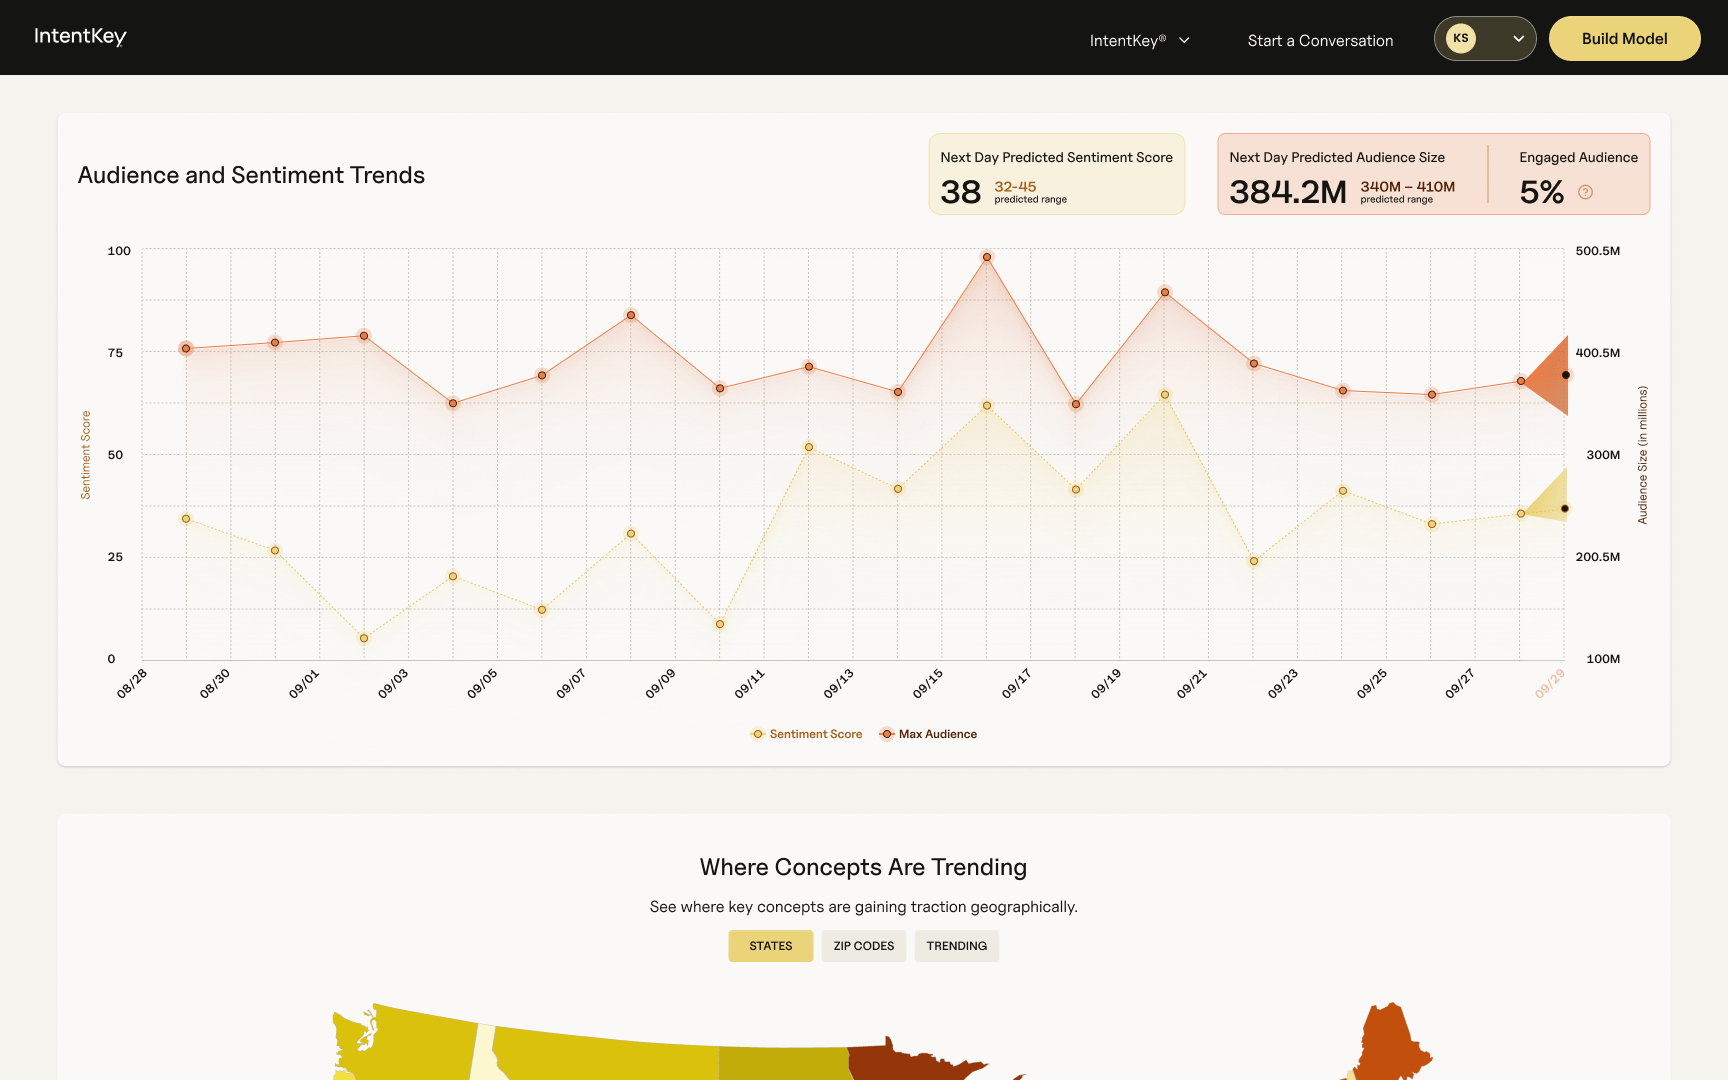
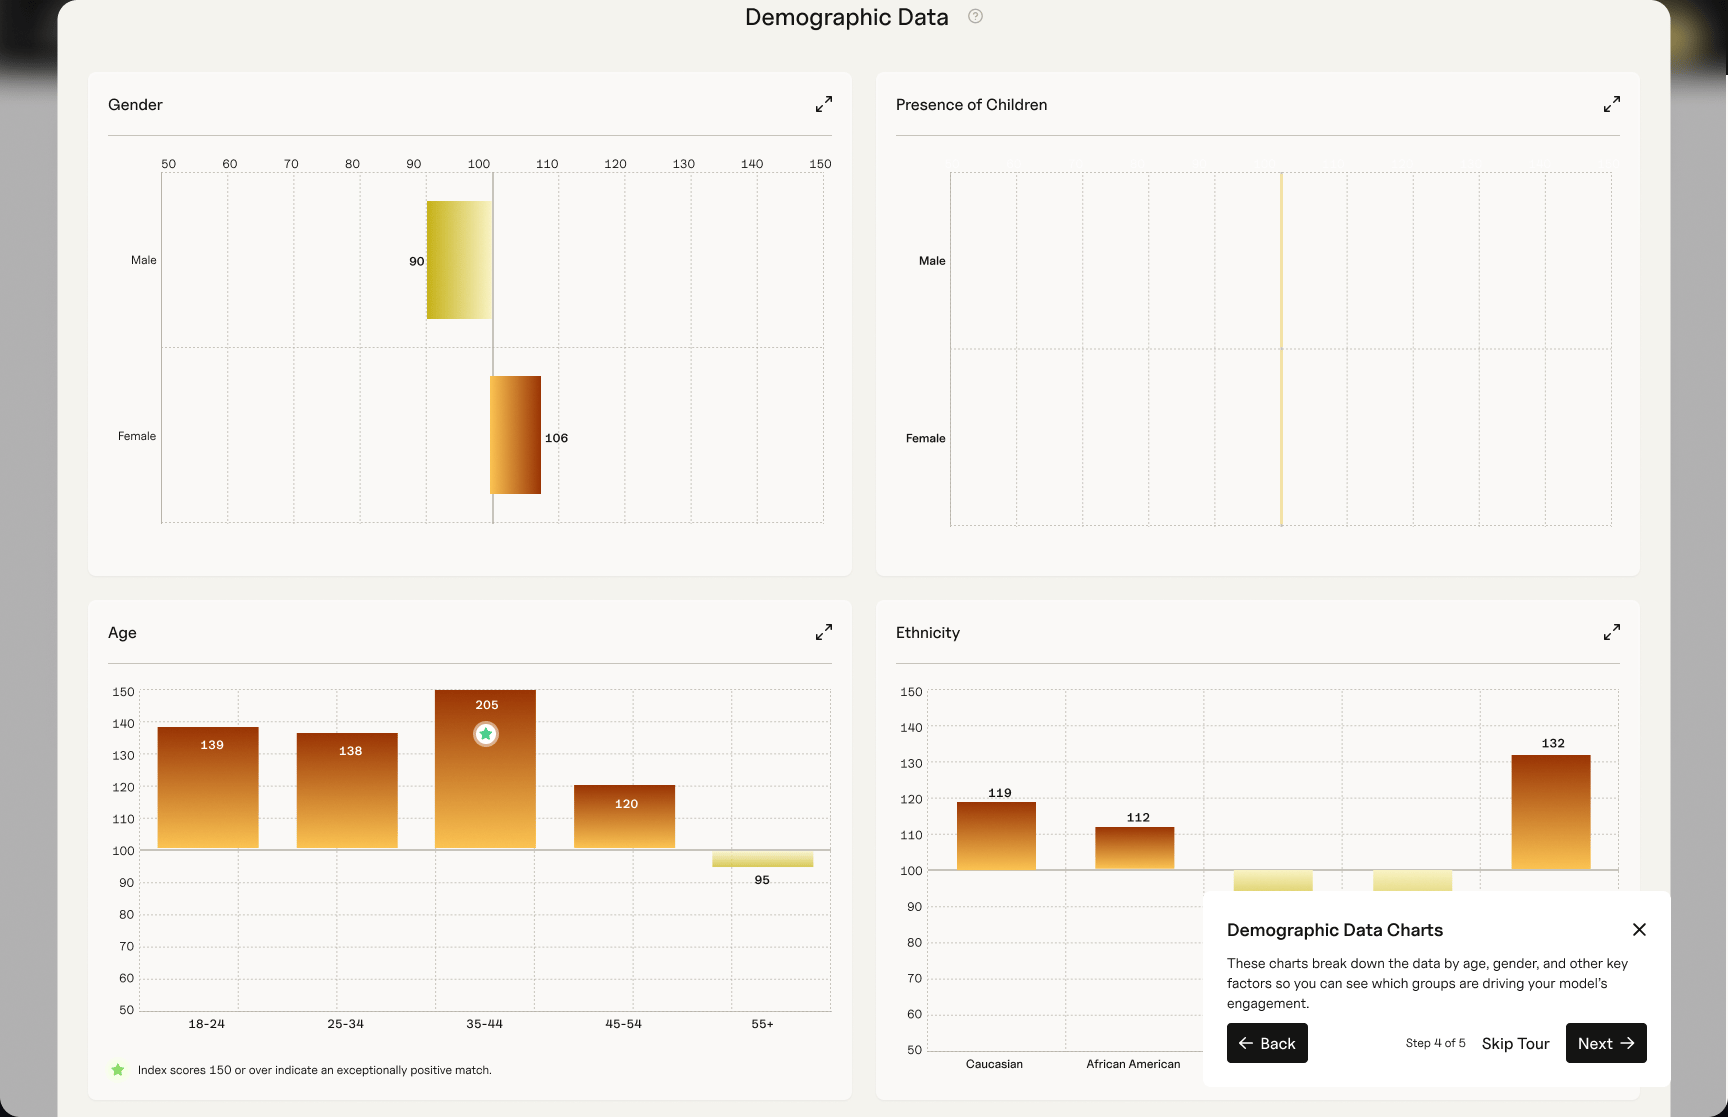
Once a model is built, the results page has to do the real work. It opens with audience and sentiment over time, led by three headline numbers: the predicted sentiment score, the predicted audience size, and how much of that audience is engaged. Below that, a map shows where the concepts are trending, and you can switch between states, zip codes, and trending concepts depending on how closely you want to look. Demographics come next, shown as index scores around a midline so you can see which groups are driving the model, with notes that explain what a high score means.
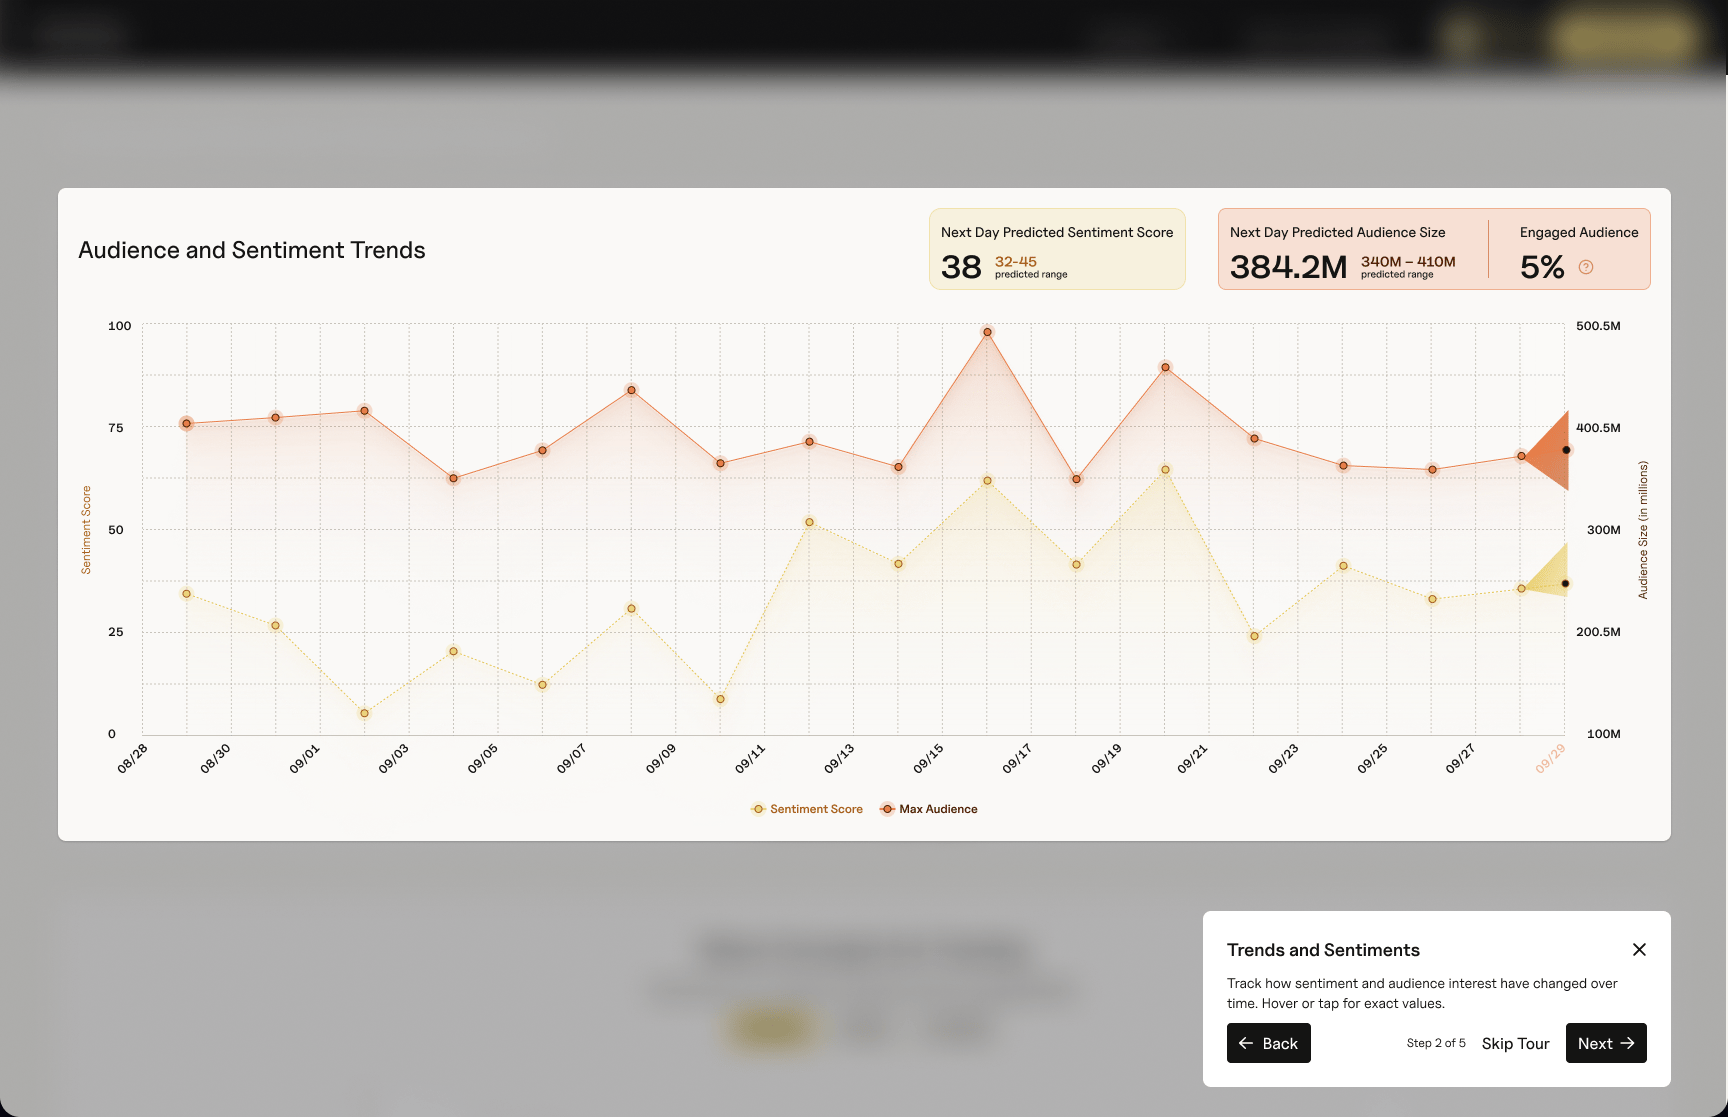
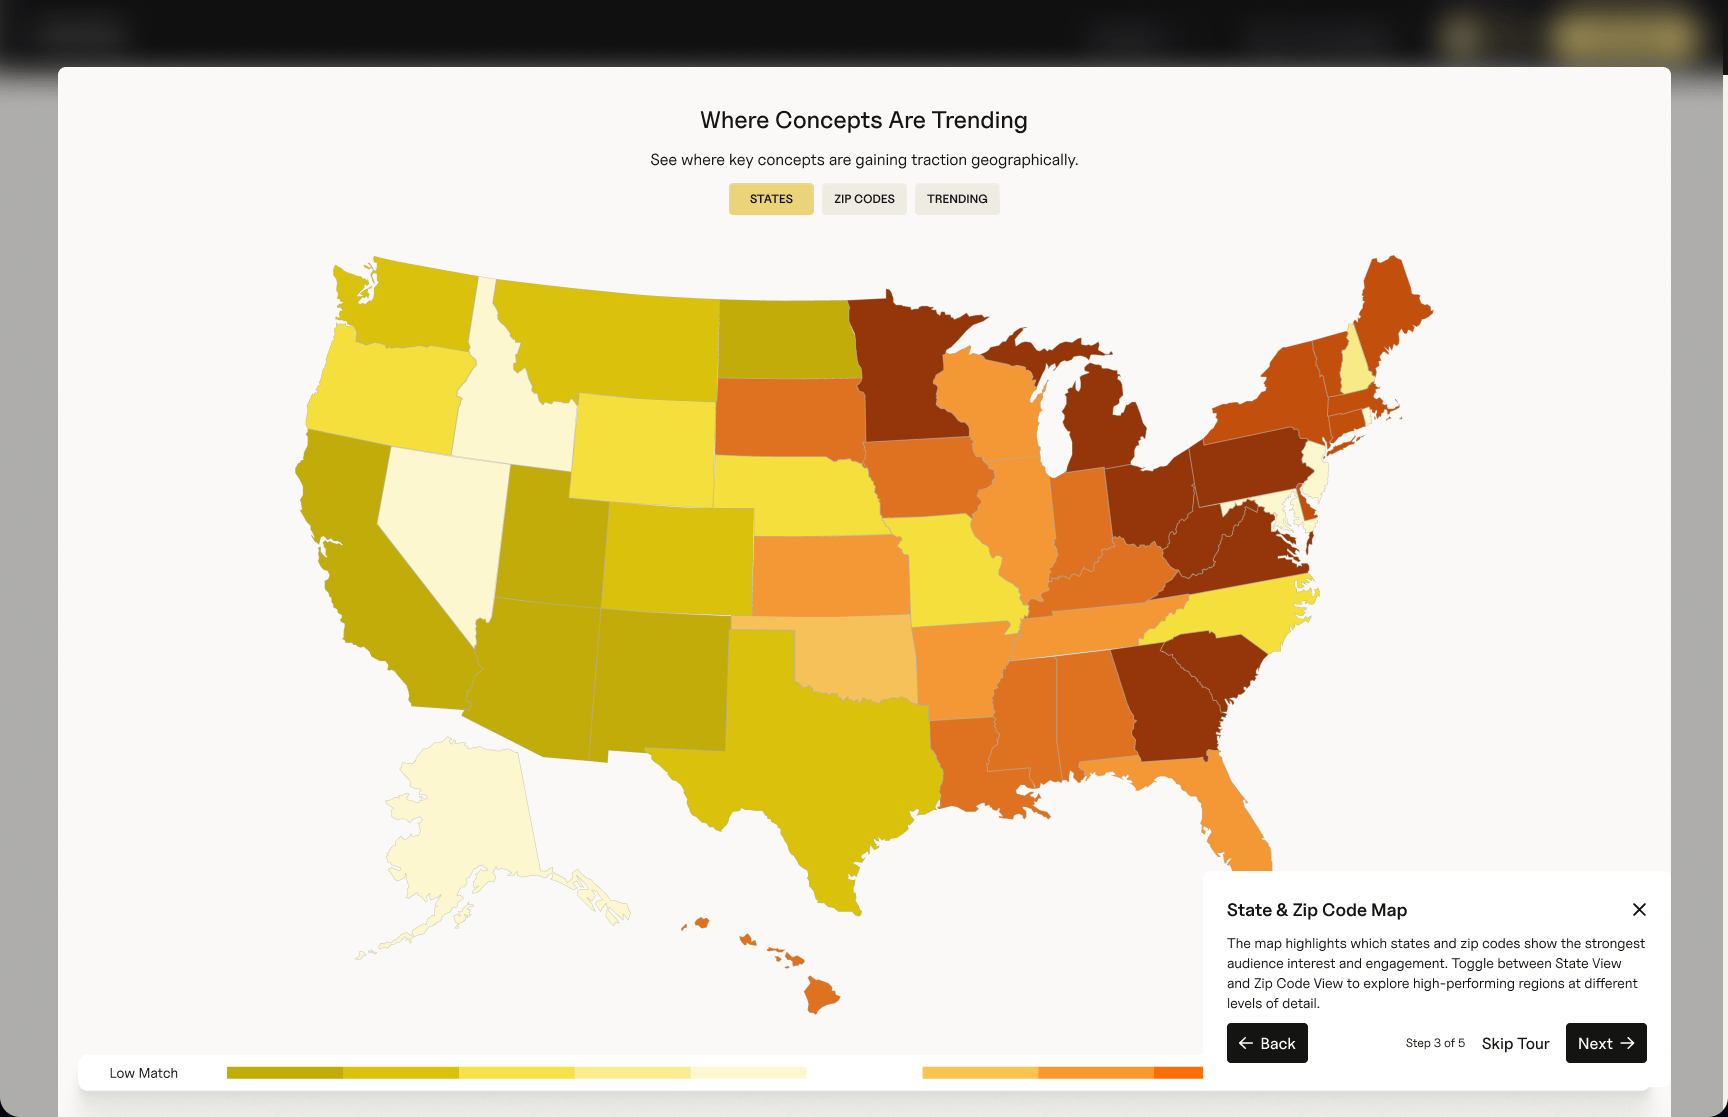
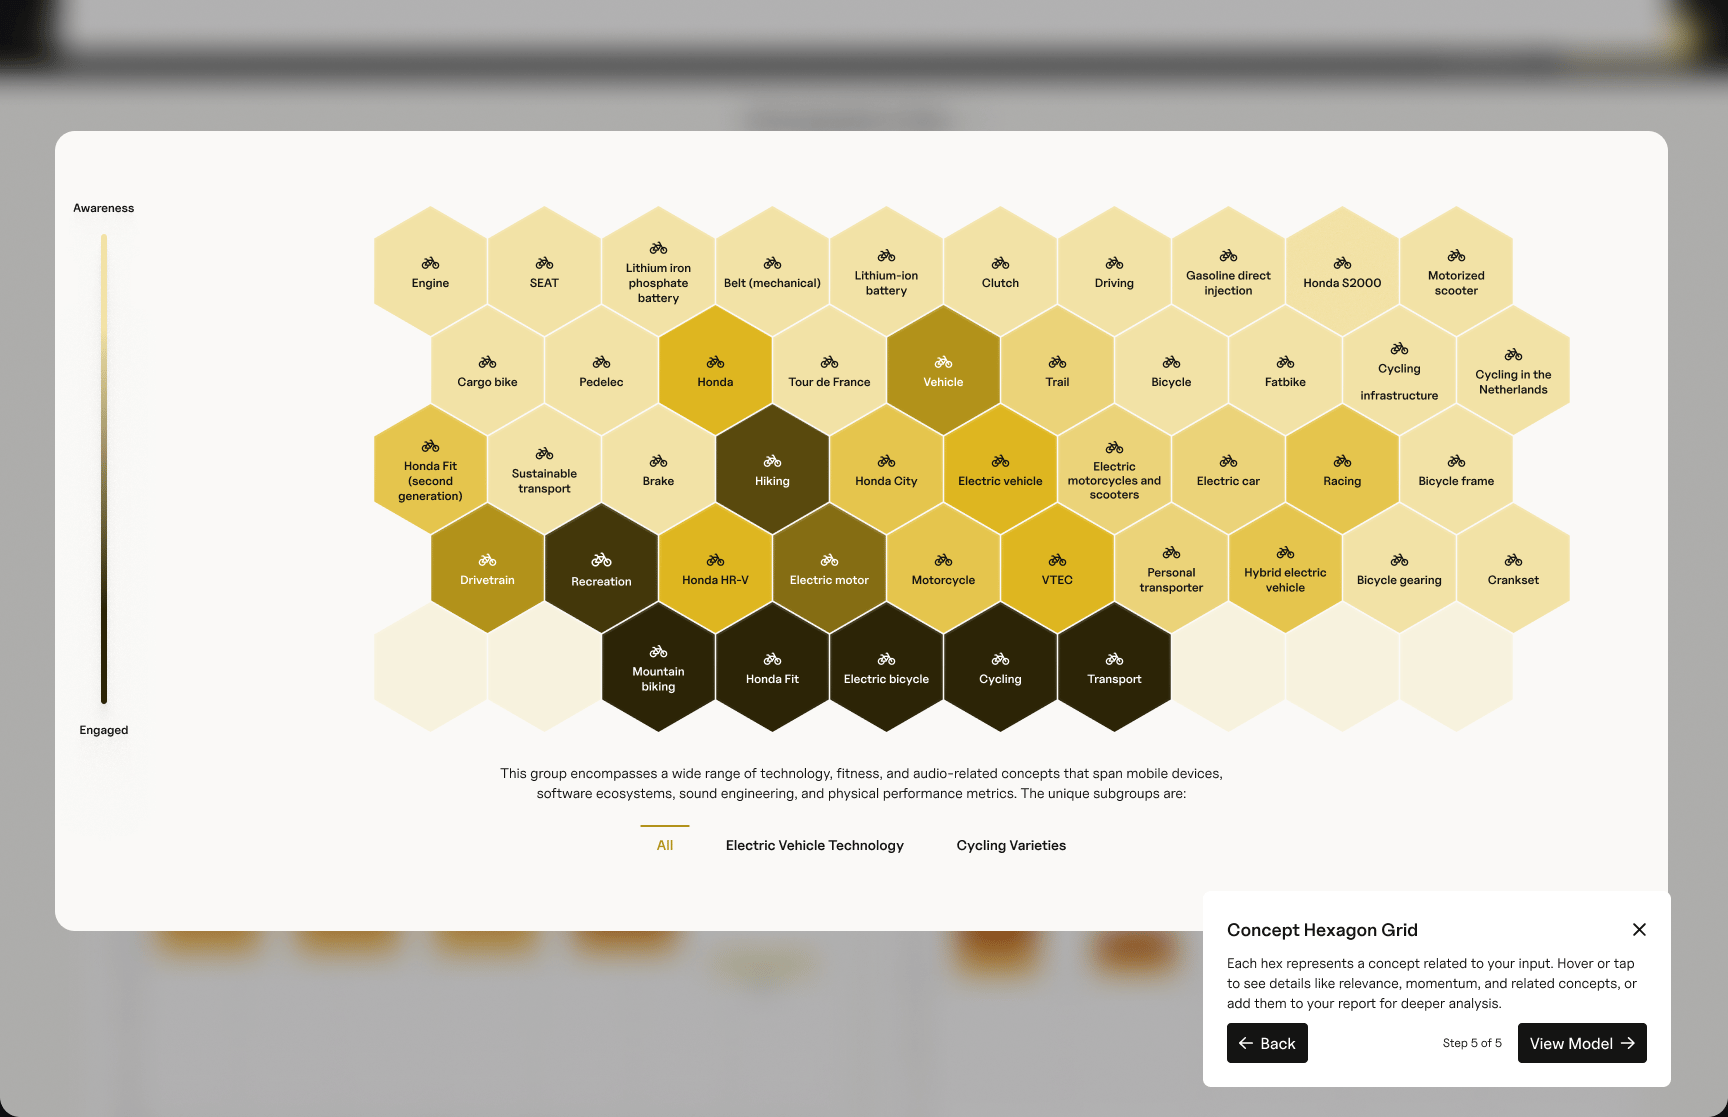
The concept grid shows the shape of the model. Each hexagon is a concept related to what you described, shaded along a scale from awareness to engagement, and you can hover or tap one to see its relevance, its momentum, and the concepts around it, or add it to your report for a closer look.
Because that is a lot for a first visit, the platform includes an example model, an Electric Bike Enthusiasts audience, with a five-step guided tour through the trends, the map, the demographics, and the concept grid in plain language. I also designed ways to edit the description and refresh the model, save it, share a link to it, and download the data. Everything in these screens is example data.
The short version: The results page turns a lot of data into a few views that a first-time customer can read.
A rebrand lands mid-stream.
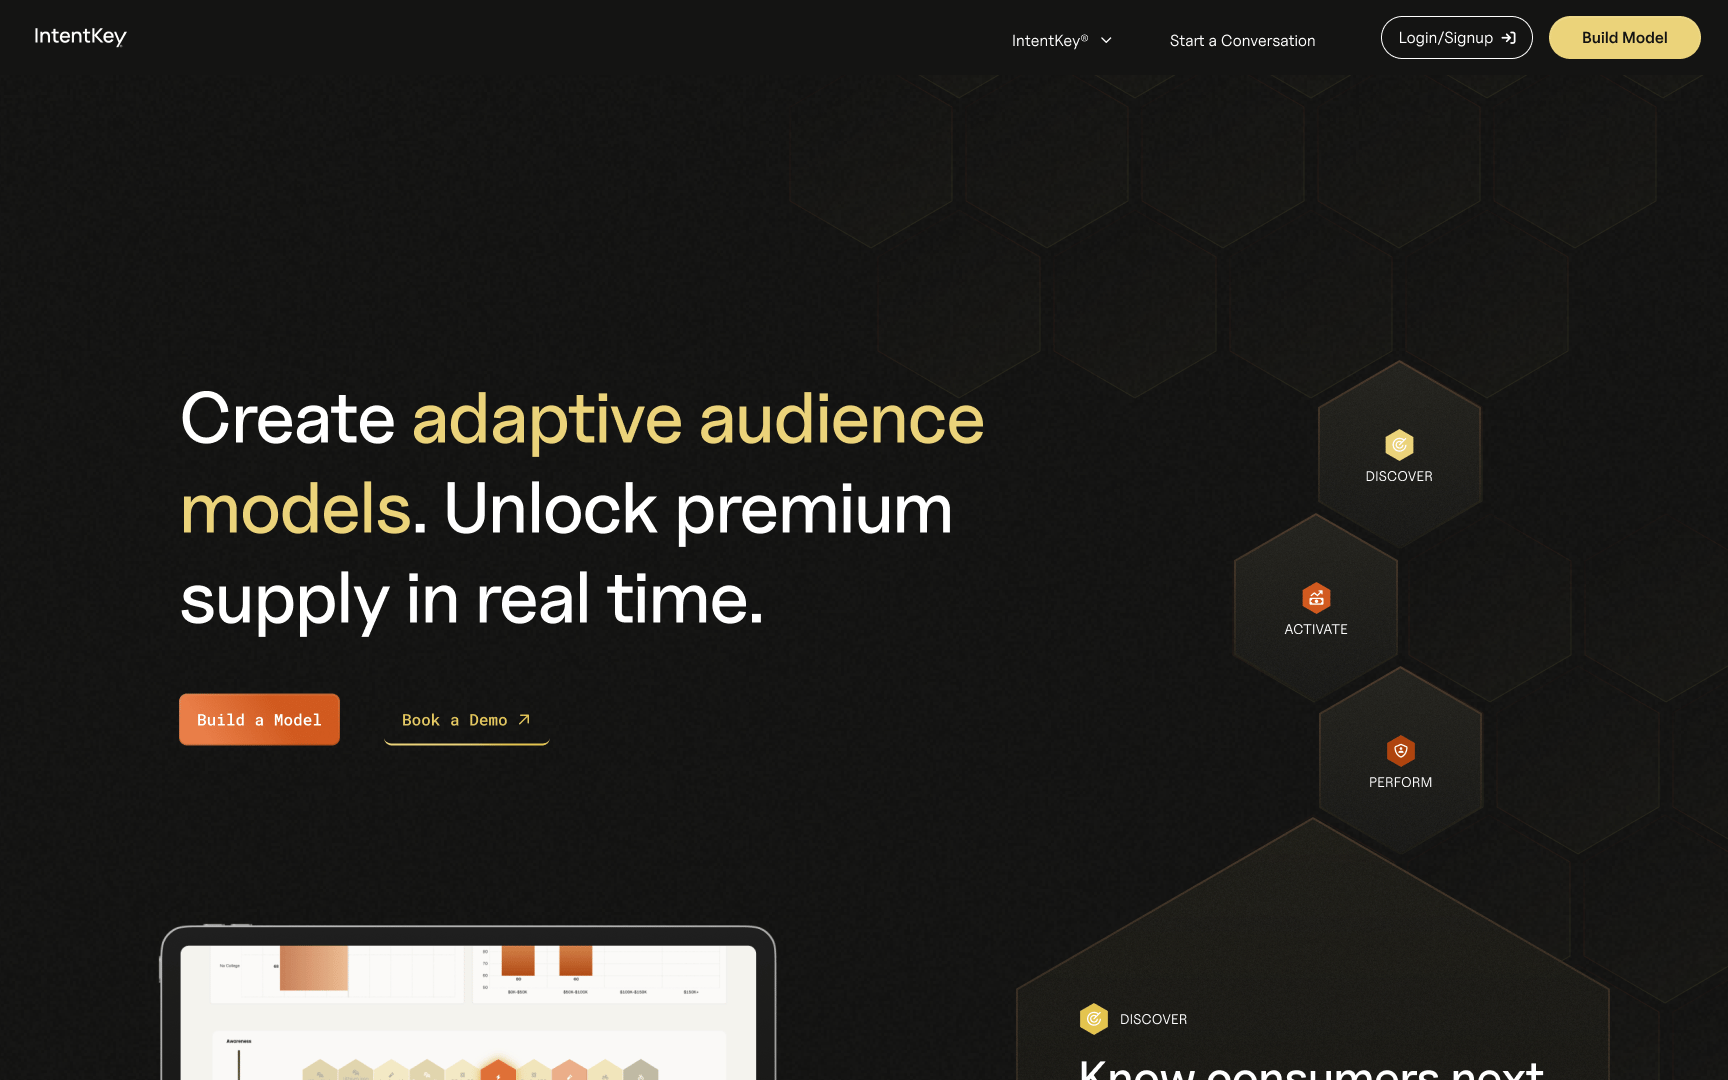
Partway through, the ground moved. The previous CEO left, and the new CEO wanted a rebrand, fast, with the homepage as a big part of it. It landed on me while engineering was building the Platform and I was still designing new features and improvements for it, so I was doing both on a compressed timeline.
It got messy. A lot of people had strong views about the homepage, and most of what made it messy was outside my control. What I could control was how I worked: I kept making the case for explaining the product clearly, I kept the way into the product easy to find, and I adapted when a decision went another way. The rebrand shipped, although the story the homepage tells is not the one I had recommended.
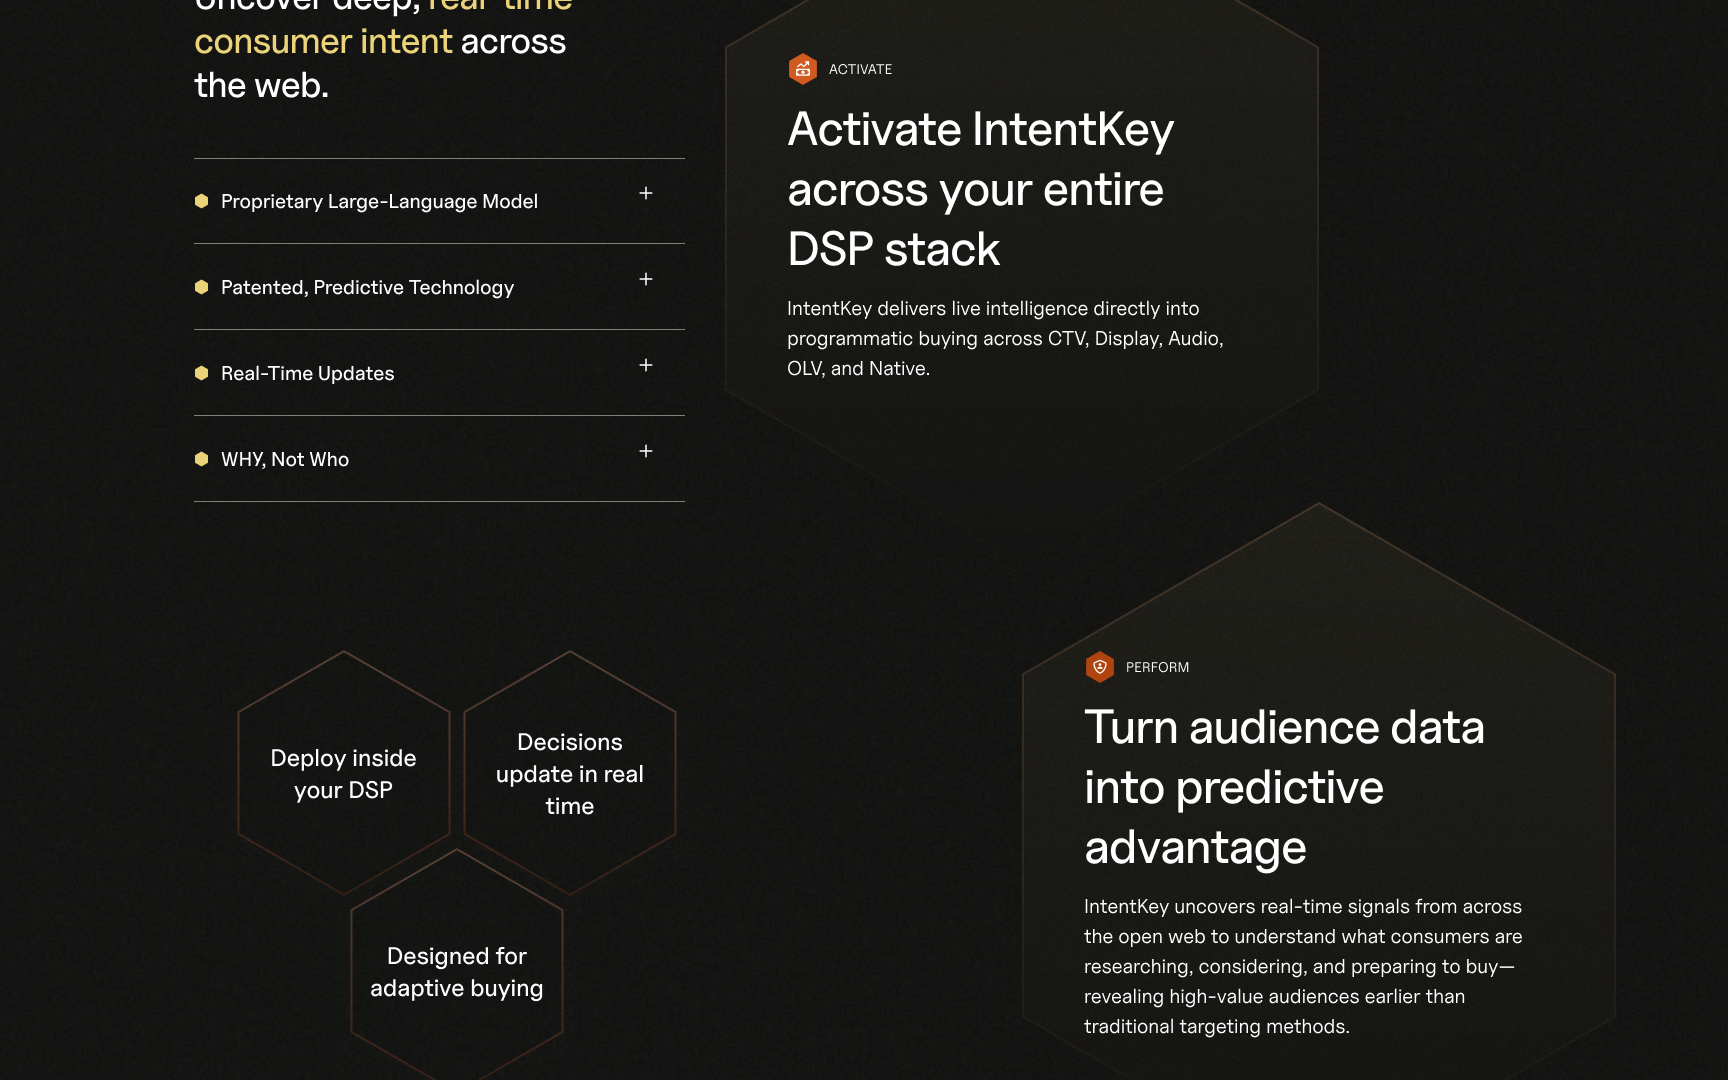
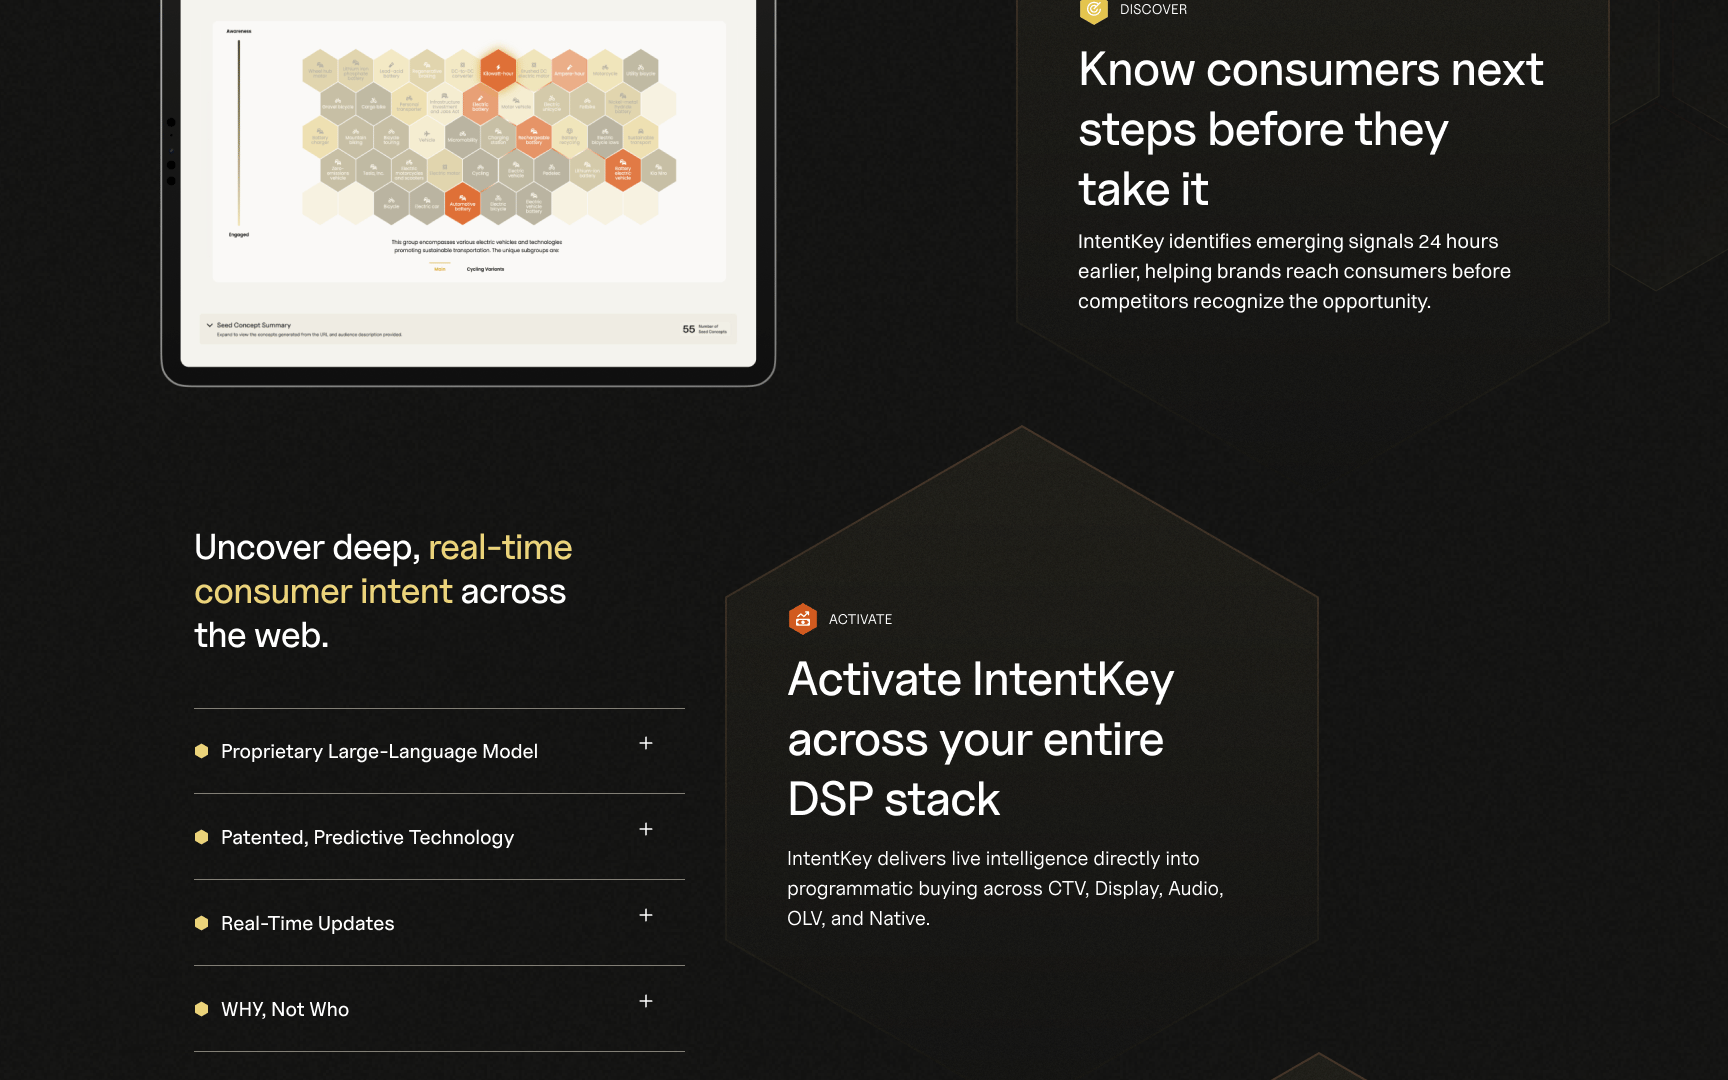
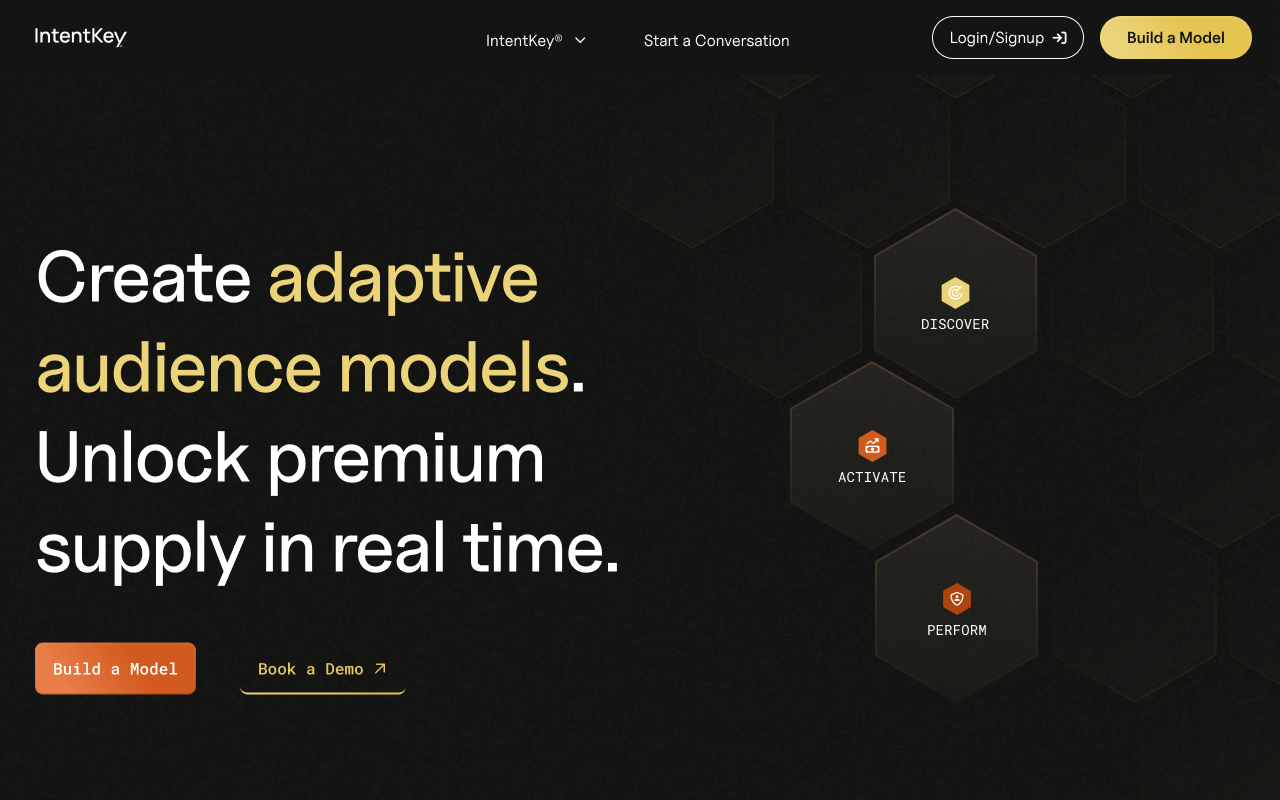
The short version: When the situation changed I changed how I worked, and I kept my attention on the customer.
The homepage I wanted to build.
One of the directions I proposed never shipped, and it is still my favorite. It opens on a single line, "One platform. Built for modern audience data and performance," with the working product right in the hero: you type an audience, press Generate, and a field of hexagons builds in front of you. A line under the field suggests a starting point, like "Audience for hybrid car shoppers." I was proud of the animation and the interaction in it, so here it is in motion.
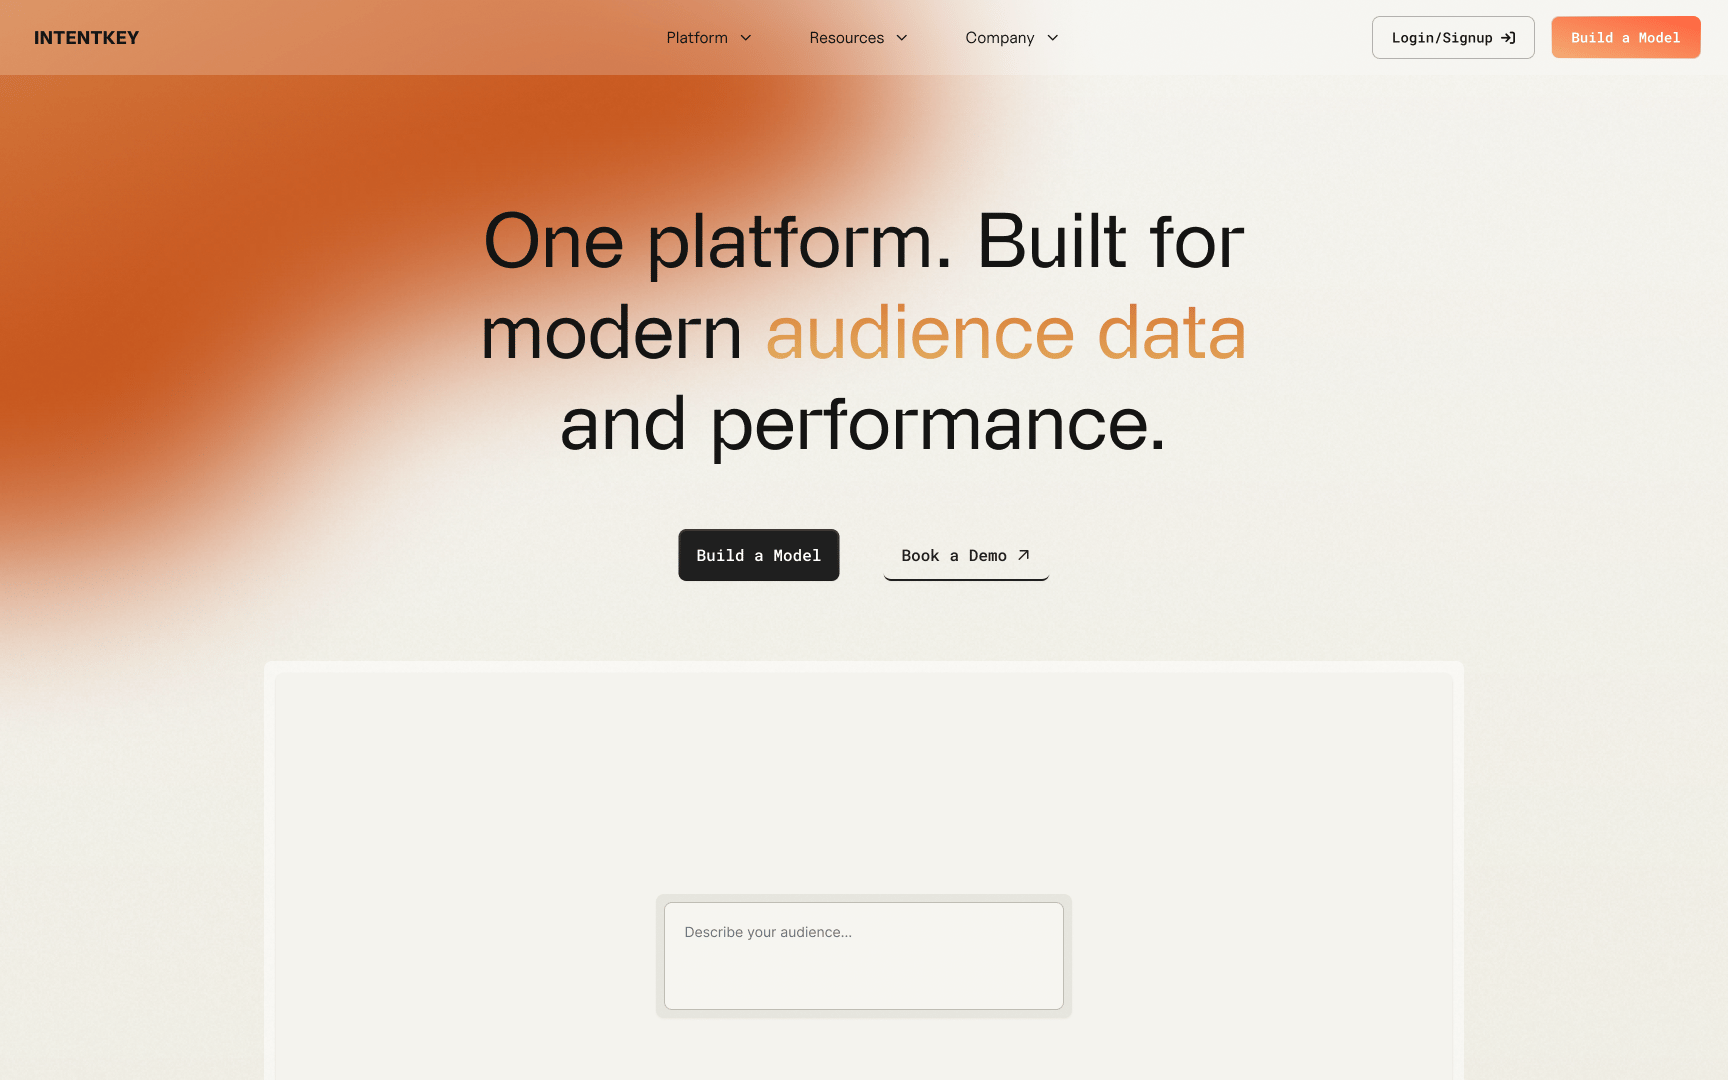
These two recordings show the hero demo up close and the results page.
The short version: Not every good idea ships, and this one is still my favorite of everything I proposed.
What changed.
The Platform gave self-service customers a way to build an audience model and read what came back, the AI-assisted description was approved, and the homepage was rebranded. IntentKey by Inuvo was named a finalist for Best Privacy Technology in the 2026 AdExchanger Awards.
The short version: A self-service customer can build a model and read it, and the AI assist was approved.
What I'd change.
Some of this was outside my control: a change in leadership, a compressed timeline, and a homepage that a lot of people wanted a say in. I wouldn't change those. What I would change is what was in my hands. I'd agree on who the homepage is for and what success looks like before designing anything, and I'd write down the options we considered and why one won, so that brand preference and evidence about users don't get mixed together. I'd run a quick comprehension test on the homepage and the first model, even a small one, and I'd track how many people start and finish building a model so the next conversation has numbers in it. And I'd settle who owns visual standards across marketing and product.
The short version: I can't control a change in leadership, but I can write down the options and why one won.